
Imagine two metal parts, both dimensionally perfect, yet one glides smoothly in its assembly while the other grinds and fails. The difference lies not in their size, but in their surface finish. Surface roughness, the microscopic peaks and valleys left by machining, is the invisible fingerprint of manufacturing that dictates performance, longevity, and cost. This complete guide deciphers the language of surface texture, from measurement to the symbols on your blueprints.
What is Surface Finish?
Surface finish, also known as surface texture or surface roughness, refers to the overall quality and characteristics of a part’s surface at a microscopic level. It is not about the part’s shape or dimensions, but about the intricate landscape left by the manufacturing process.

Think of it as the “terrain” of the surface, composed of three elements:
- Roughness (Ra, Rz): The finely spaced, high-frequency irregularities resulting from the machining process itself (e.g., tool marks from milling).
- Waviness (Wa): The more widely spaced, lower-frequency deviations often caused by machine tool vibrations, deflection, or heat treatment.
- Lay: The predominant direction of the surface pattern, determined by the machining method (e.g., circular from turning, parallel from milling).
Why is Surface Finish Critical in Manufacturing?
Specifying the correct surface finish is a critical engineering decision with far-reaching consequences:
- Wear & Fatigue Resistance: A smoother surface reduces friction and stress concentration points, significantly increasing a component’s lifespan.
- Sealing & Lubrication: Proper roughness can trap lubricant for hydrodynamic bearings or create an effective seal with gaskets.
- Aesthetic & Hygiene: Cosmetic parts require a polished finish, while medical and food-grade components need easily cleanable, non-porous surfaces.
- Coating Adhesion: Paint, plating, and anodizing require a specific surface profile (often measured as Rz) for optimal bonding.
- Cost Control: Over-specifying an ultra-fine finish (e.g., requiring polishing after grinding) can exponentially increase manufacturing costs without providing functional benefit.
How to Measure Surface Roughness: Methods & Tools
Accurately measuring surface roughness is essential for quality control, process validation, and ensuring components meet their functional requirements. The measurement translates the physical texture of a surface into quantifiable numerical parameters, most commonly Ra (Average Roughness) and Rz (Maximum Height). The methods fall into two primary categories: Contact and Non-Contact.

1. Contact Measurement Methods
This traditional approach involves a physical probe tracing the surface profile.
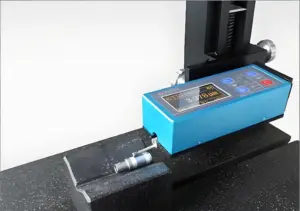
Primary Instrument: Stylus Profilometer (Surface Roughness Tester)
This is the industry-standard, most widely used method for 2D roughness measurement.
How It Works:
A very fine diamond-tipped stylus (tip radius typically 2-5 μm) is drawn across the surface at a constant speed. The vertical movements of the stylus as it rides over peaks and valleys are magnified and converted into an electrical signal. This signal is processed to calculate standard roughness parameters.
Key Components:
- Stylus/Pickup: The physical probe. Its radius and force are critical to avoid scratching delicate surfaces.
- Skid or Skidless Reference: A skid rides on the surface to establish a relative datum, while skidless systems use an internal precision guide for absolute measurement.
- Drive Unit: Moves the stylus at a controlled tracing speed and length.
- Processor/Display Unit: Analyzes the signal, applies filters (e.g., Gaussian), and outputs parameters (Ra, Rz, Rq, etc.).
Types of Profilometers:
- Portable Handheld Testers: Ideal for shop-floor use. Compact, battery-operated, and provide instant Ra/Rz readings on the spot (e.g., Mitutoyo SJ-410, Time TR200).
- Benchtop/Stationary Systems: Offer higher precision, more parameters, and detailed graphical output. Used in quality labs for detailed analysis and reporting.
Advantages & Limitations:
| Advantages | Limitations |
|---|---|
| • Direct, traceable, and standardized method (ISO 4287, ASME B46.1). | • Contact method: Risk of scratching soft materials (plastics, polished surfaces). |
| • Excellent vertical resolution (down to nanometers). | • Measures only a single 2D line profile, not a full 3D area. |
| • Robust and reliable in various industrial environments. | • Slow compared to optical methods. |
| • Can measure deep grooves and steep slopes effectively. | • Stylus size limits access to very small or complex internal features. |

2. Non-Contact Measurement Methods
These optical methods use light to capture surface topography without physical contact, ideal for delicate or clean surfaces.
a) Optical Profilometry (White Light Interferometry – WLI)
How It Works: A beam of white light is split between the sample surface and a reference mirror. The recombined light creates interference fringes. A camera captures these fringes as the objective lens scans vertically. Sophisticated software analyzes the interference pattern to construct a detailed 3D topographic map of the surface.
Best For:
- Smooth to very smooth surfaces (Ra < 0.1 μm).
- Delicate materials (thin films, coatings, soft polymers).
- Detailed 3D analysis for parameters like Sa (3D equivalent of Ra), volume, and functional characteristics.
b) Laser Scanning Confocal Microscopy
How It Works: A laser point is focused onto the surface, and a confocal pinhole eliminates out-of-focus light. By scanning the laser point across the area and recording the height at which maximum intensity is detected, a precise 3D image is built.
Best For:
- Surfaces with high aspect ratios or steep sidewalls.
- Measuring step heights and complex 3D geometries.
- Combining high-resolution roughness measurement with optical microscopy imaging.
c) Focus-Variation Microscopy
How It Works: An optical system with a small depth of focus scans vertically. For each X-Y point, the system finds the “best focus” position. The vertical position of best focus for each point is used to build a 3D model.
Best For:
- Measuring rough surfaces with both fine texture and large form.
- Materials with varying reflectivity.
Advantages & Limitations of Optical Methods:
| Advantages | Limitations |
|---|---|
| • Non-contact: No risk of damage. | • Generally higher cost than contact profilometers. |
| • Fast 3D area measurement. | • Can struggle with very rough, shiny, or transparent surfaces that scatter or transmit light. |
| • Excellent for mapping and advanced analysis. | • Vertical measurement range can be limited compared to stylus. |
| • High lateral resolution. | • Requires more controlled environment and user expertise. |
Choosing the Right Method: Quick Comparison Table
| Measurement Need | Recommended Primary Tool | Key Reason |
|---|---|---|
| Shop-floor QC of machined parts | Portable Stylus Profilometer | Rugged, fast, direct Ra/Rz reading, standardized. |
| Lab analysis of standard components | Benchtop Stylus Profilometer | High precision, full parameter set, compliance with standards. |
| Measuring soft, delicate, or coated surfaces | Optical Profilometer (WLI) | Non-contact, prevents damage, provides 3D data. |
| Full 3D texture/areal analysis | Optical Profilometer or Confocal Microscope | Captures surface texture anisotropy, voids, and material ratio (Abbott-Firestone curve). |
| Combining roughness measurement with visual inspection | Laser Confocal or Focus-Variation Microscope | Integrates high-magnification imaging with topographic data. |
Surface Roughness Symbols Chart and Abbreviations
The language of surface finish is communicated on technical drawings through standardized surface finish symbols.

Understanding the Symbol Structure:
- Basic Symbol: A checkmark-like shape. By itself, it indicates that a surface must be machined, but any method is acceptable.
- Circle in the V: A circle added to the vertex means the surface must be produced by material removal (machining).
- Bar on Top of the V: A horizontal bar indicates that material removal is prohibited. The surface must be produced by casting, forging, etc., or left as-supplied.
Common Abbreviations in Callouts:
- Ra: Arithmetical Mean Roughness (e.g., Ra 0.8 μm)
- Rz: Maximum Height of Profile
- Rmach: Roughness obtained by machining
- N1-N12: Old “Finish Numbers” (see chart below)
- C: Casting or forging skin
- M: Machining required
- G: Grinding required
Surface Roughness Chart
This chart provides a direct comparison between standard Ra values, the old N-number system, common manufacturing processes, and typical applications.
| Ra Value (μm) | Ra Value (μin) | N (Finish Number) | Typical Manufacturing Process | Visual Appearance & Common Applications |
|---|---|---|---|---|
| 25 | 1000 | N12 | Flame cutting, sawing, sand casting. | Very rough, deep grooves. Non-critical structures, hidden surfaces. |
| 12.5 | 500 | N11 | Rough machining (turning, milling), forging. | Obvious tool marks, rough to touch. Non-bearing surfaces, bolt clearance holes. |
| 6.3 | 250 | N10 | Standard, economical machining. | Visible tool marks. General machine parts, non-critical bearing surfaces. |
| 3.2 | 125 | N9 | Most common “as-machined” finish. | Clear but not deep tool marks. Gasket faces, hydraulic seals, non-moving parts. |
| 1.6 | 63 | N8 | High-quality machining, fine turning, reaming. | Barely visible tool marks. Bearing surfaces, shafts, gears, precision components. |
| 0.8 | 32 | N7 | Grinding, honing, broaching. | Directional grind lines, smooth to touch. Cylinder walls, cam faces, sliding surfaces. |
| 0.4 | 16 | N6 | Precision grinding, diamond turning. | Satin finish, no visible grain. High-speed bearings, medical implants, optical mounts. |
| 0.2 | 8 | N5 | Honing, lapping, polishing. | Very smooth, semi-gloss. Gauge surfaces, seal faces, high-pressure valves. |
| 0.1 | 4 | N4 | Super-finishing, mirror polishing. | Mirror-like, no visible texture. Precision optics, instrument pivots, high-end seals. |
| 0.05 | 2 | N3 | Lapping, superfinishing. | Optical-quality mirror finish. Laser components, high-precision gauges. |
Conclusion
Mastering surface roughness is fundamental to bridging design intent with manufacturing reality. By understanding the symbols, values, and implications charted in this guide, engineers can make informed decisions that balance performance, durability, and cost. Always remember: the right finish is not necessarily the smoothest finish—it’s the one that fulfills the part’s function most efficiently.
FAQ – Surface Roughness Chart
What is the most common surface finish for machined parts?
A roughness of Ra 3.2 μm (125 μin), corresponding to N9, is often considered the standard, economical “as-machined” finish for general components. For higher-quality parts, Ra 1.6 μm (63 μin) or N8 is frequently specified.
What is the difference between Ra and Rz?
Ra is the arithmetic average of deviations, giving a good overall measure. Rz measures the maximum peak-to-valley height within a sample, which is better for identifying extreme variations that could cause issues like leakage or stress concentration.
How do I choose the right surface finish?
Start with the function. Consider friction, wear, sealing, fatigue, and assembly needs. Consult with your machinist or manufacturing engineer, as they can advise on the most cost-effective process to achieve the required finish.
Can surface finish be too smooth?
Yes. An excessively smooth surface can lack the necessary texture to retain lubricant, leading to increased wear in moving parts. It also dramatically increases manufacturing cost with minimal functional benefit if not truly required.
What does “N8” finish mean?
The “N” system (N1-N12) is an older classification. N8 generally corresponds to an Ra value of 1.6 μm (63 microinches). It’s a fine machined or ground finish suitable for bearing surfaces and precision components.